interimage:examples:example4
Tabela de conteúdos
Example 4 - Performing a thresholding
This example shows how to perform a thresholding using InterIMAGE.
Database
Step by step
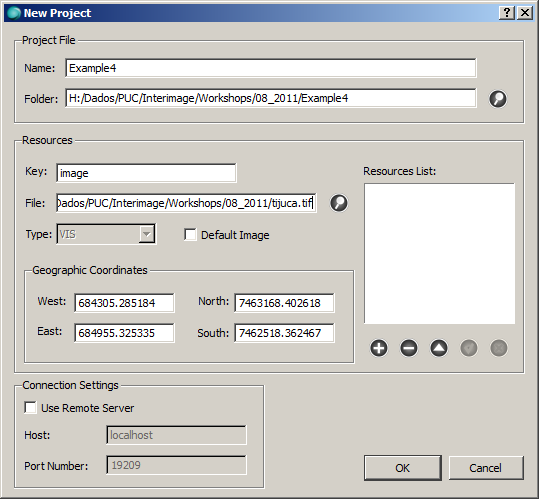
- Start InterIMAGE. Click on File → New Project and fill the fields according to the following:
- Check the Default Image checkbox and click the Add button. Click OK.
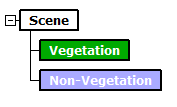
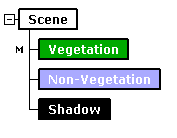
- Create a semantic net like this one:
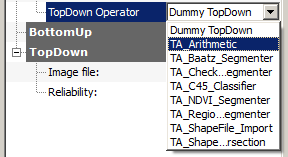
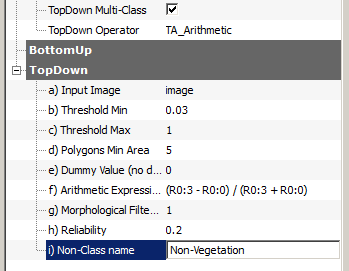
- Associate the TA_Arithmetic top-down operator to the Vegetation node. Set the operator parameters according to the image below. Make sure the TopDown Multi-class checkbox is checked.
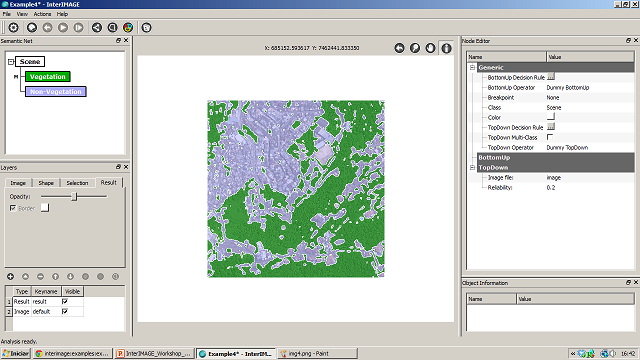
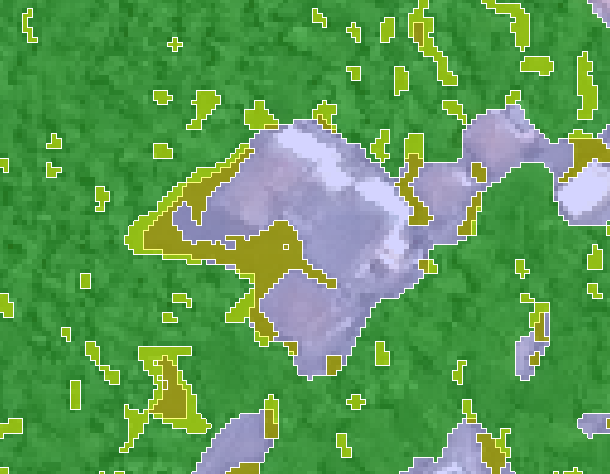
- Save the project and execute the interpretation. You should obtain something like this:
- You can change the parameters values and re-execute the interpretation until you are satisfied with the result.
- Now, add a Shadow node.
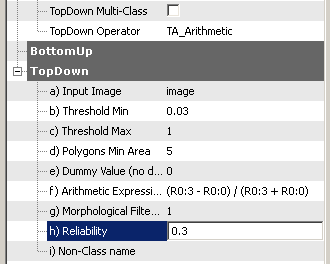
- Select the Vegetation node. Uncheck the TopDown Multi-Class checkbox and set its parameters according to the image below:
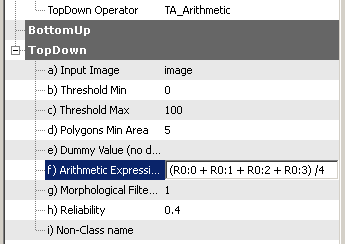
- Associate the TA_Arithmetic top-down operator to the Shadow node. Set the operator parameters according to the following:
- Save the project and re-execute the interpretation.
- The aim of this step was to show how the reliability values affect the interpretation process. Basically, if two polygons are competing for the same image region, the one with the higher reliability value will prevail. In this case, we had this priority list: 1. Shadow, 2. Vegetation and 3. Non-vegetation.
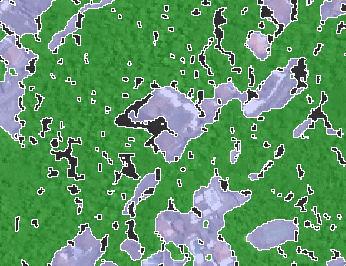
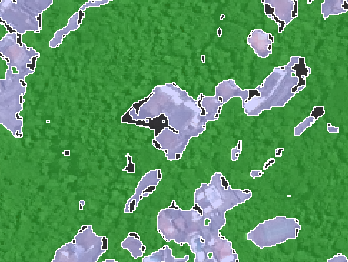
- Now, try to change the reliability value of the Vegetation node to 0.5. Save the project and re-execute the interpretation. By doing it, we are taking the Vegetation class to the front of the list. Here is a comparison between the two results:
- Sometimes, it can be interesting to know how this decision process takes place. Let's see what happened to the original Shadow polygons by adding this information to the visualization window.
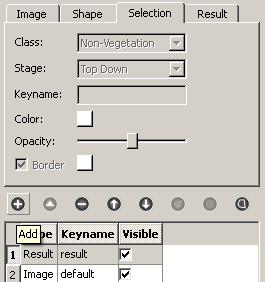
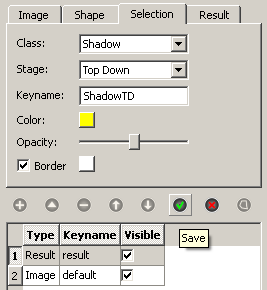
- Select the Selection tab and click the Add button. Fill the fields according to the image below then click Save.
- By using the visualization tools you can compare which Shadow regions remained and which were discarded.
interimage/examples/example4.txt · Última modificação: 2011/08/16 20:59 por rsilva

