interimage:examples:example5
Tabela de conteúdos
Example 5 - Debugging and exploration of attributes
This example shows how to debug and explore polygons attributes.
Database
Step by Step
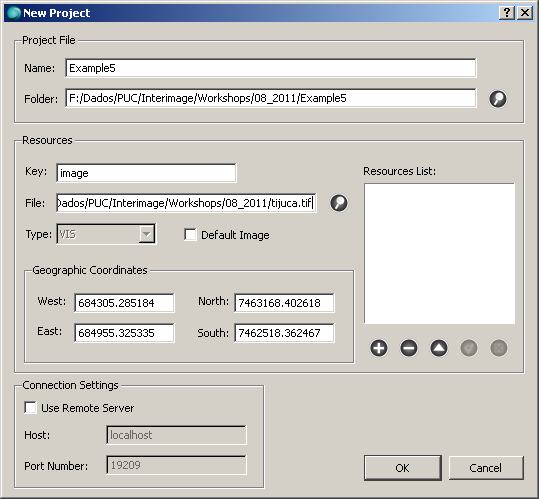
- Start InterIMAGE. Click on File → New Project and fill the fields according to the following:
- Check the Default Image checkbox and click the Add button. Click OK.
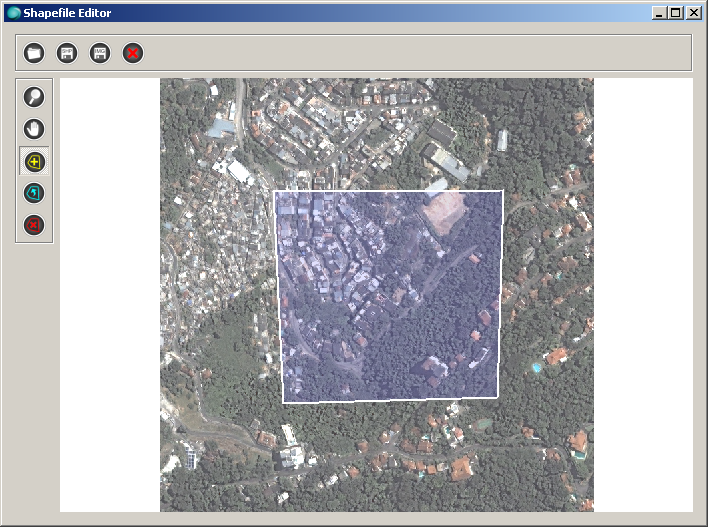
- Open the Shapefile Editor.
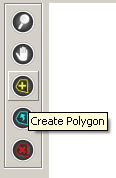
- In the window that comes up select the Create Polygon tool and draw a simple polygon.
- After, click the Save ESRI Shapefile button. Give a name for your shapefile, roi.shp for example. Click Save.
- Close the Shapefile Editor window.
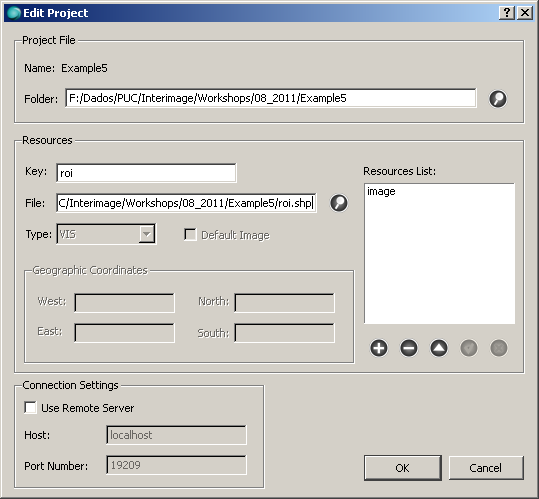
- Click on File → Edit Project. Fill the fields according to the following:
- Click the Add button. Click OK.
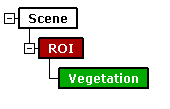
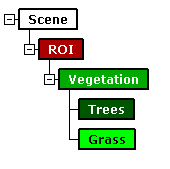
- Create a sementic net like this one:
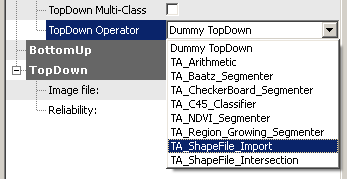
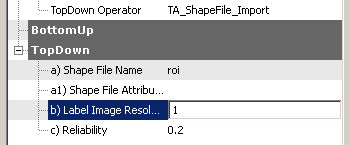
- Associate the TA_Shapefile_Import top-down operator to the ROI node. Set the operator parameters according to the following:
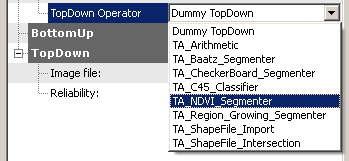
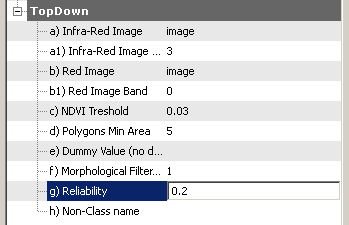
- Associate the TA_NDVI_Segmenter top-down operator to the Vegetation node. Set the operator parameters according to the following:
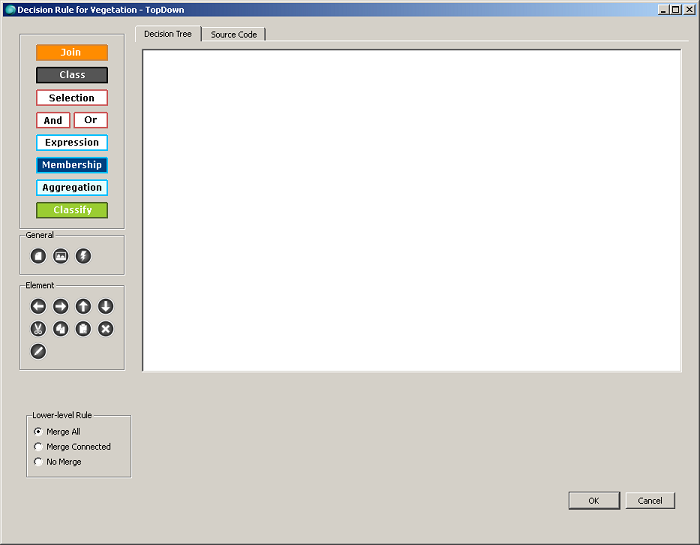
- Select the Vegetation node and click the TopDown Decision Rule button.
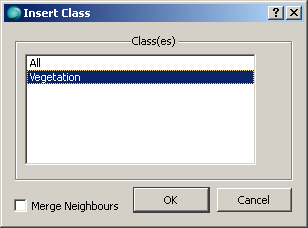
- In the dialog that comes up click the Class button and select the Vegetation class. Click OK. Make sure that the Merge All option is selected and click OK again.
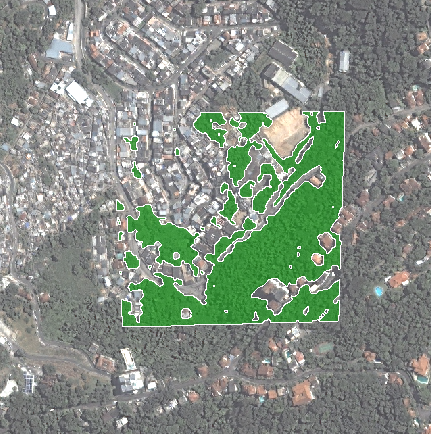
- Save the project and execute the interpretation.
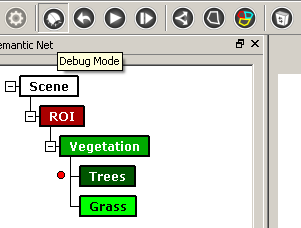
- Now, add two nodes to the semantic net: Tress and Grass.
- Select the Grass node. Right-click it and clik on Enable/Disable, disabling it.
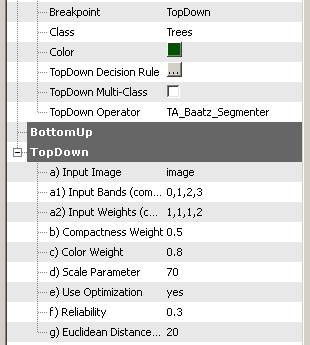
- Now, select the Trees node and change the breakpoint field to TopDown. Select the TA_Baatz_Segmenter top-down operator and set the operator parameters according to the following:
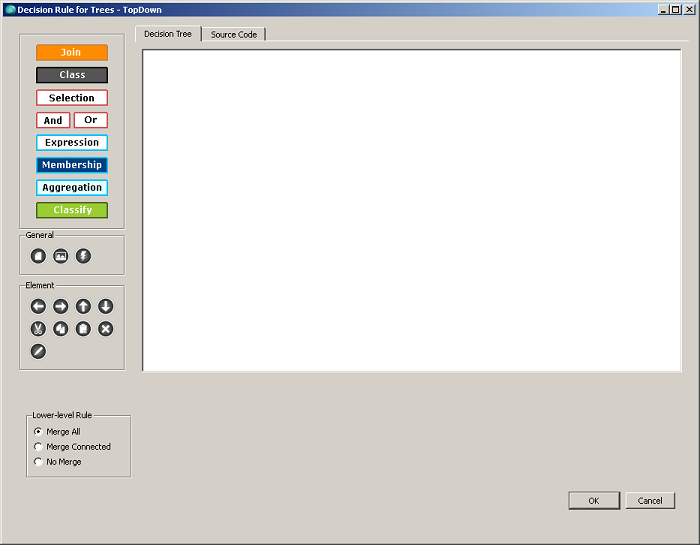
- Select the Trees node and click the TopDown Decision Rule button.
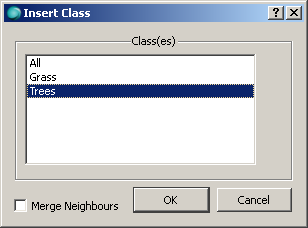
- In the dialog that comes up click the Class button and select the Trees class. Click OK. Make sure that the No Merge option is selected and click OK again.
- Click the Debug Mode button and save the project. Execute the interpretation.
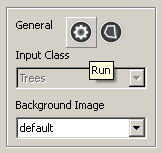
- When the interpretation pauses, click the Analysis Explorer button.
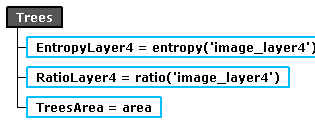
- In the window that appears add three Expression blocks according to the figure below. Then click Run.
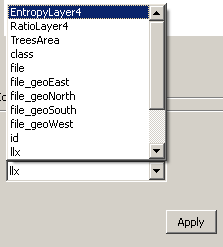
- Click the Attribute View button. Then select one of the new attributes and click Apply. Repeat the operation with the other attributes.
- You may want to use the Zoom and Pan tools to facilitate viewing the polygons. Increasing the Output Layer opacity may help too.
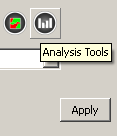
- Click the Analysis Tools button and click Apply.
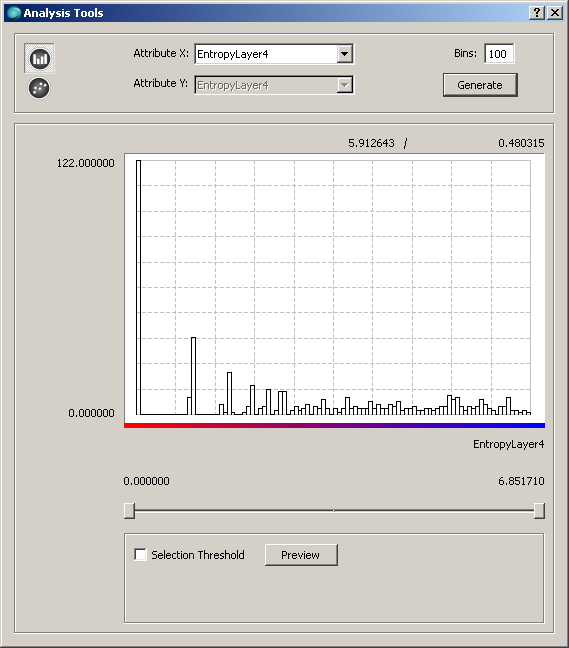
- In the window that appears click the Histogram button. Select one of the new attributes and click Generate.
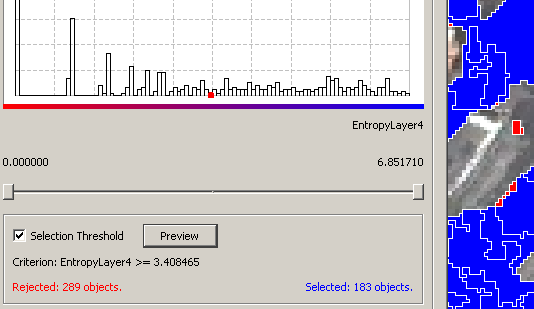
- Check the Selection Threshold checkbox. A red dot will appear over the histogram graph. This dot represents the “cut” value, polygons with attribute values above this threshold will be selected and the others rejected. Drag the red dot to change the threshold value and then click Preview. Repeat the operation with the other attributes.
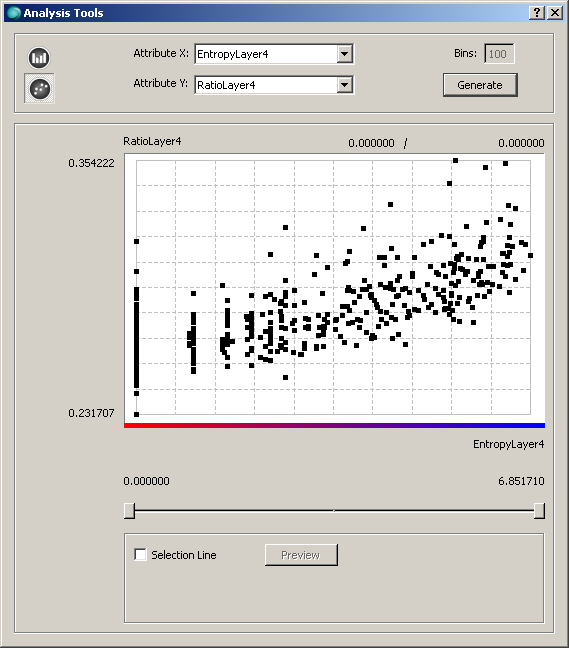
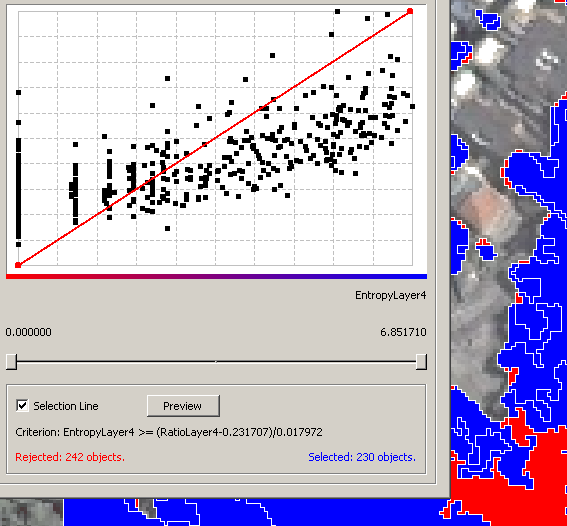
- Now, click the Scatter Plot button. Select two of the new attributes and click Generate.
- Check the Selection Line checkbox. A red line will appear over the scatter plot. This lines represents the “cut” line, polygons with attribute values to the right of the line will be selected and the others rejected. Drag the line dots to change the selection. Repeat the operation with the other attributes.
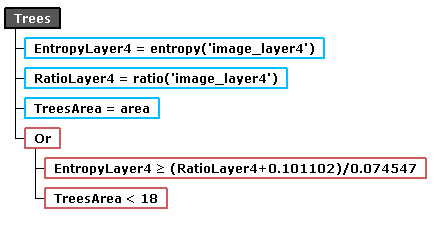
- The idea here is, after adjusting the thresholds, to copy the criterion expression and insert it into the Decision Rule as a Selection block.
- As an example, close the Analysis Tools window and change your decision rule this way:
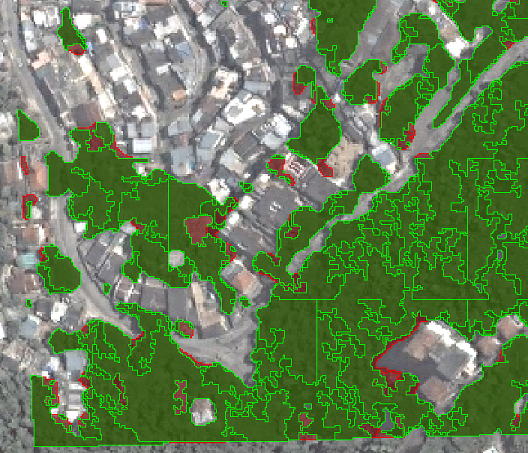
- After, click the Selection View button and click Run.
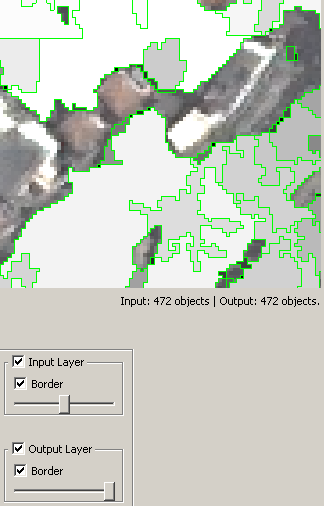
- Once the execution is finished, notice which objects were in the Input Layer (red polygons) and which remained in the Output Layer (green polygons).
- If you are satisfied with the result, click OK. Otherwise, you can try to improve the classification result adjusting the thresholds.
- Click OK. The system will execute your final decision rule and pause. Click Continue for the interpretation to continue until the end.
- Enable the Grass node and click the Debug Mode button, deselecting it.
- Save the project and run the interpretation.
interimage/examples/example5.txt · Última modificação: 2011/08/22 18:44 por rsilva

